The Carbon Budget — Living Beyond Our Means
There are good reasons to calculate our carbon budget. The carbon pie shows how much CO2 we’ve got to play with, how much we’ve used and how fast we’re using it. This isn’t a license to pollute, but a warning about how much we have already polluted. As long as we didn’t precisely know how much carbon we could emit, it was easier for those with responsibility to run away from it or push it ahead of them. The carbon pie should be a visceral reminder of how urgent the problem has become and it should compel governments to reflect on what they all need to do to avoid overshooting. The small remaining carbon space no longer allows anyone to continue with business-as-usual.
What’s the carbon budget?
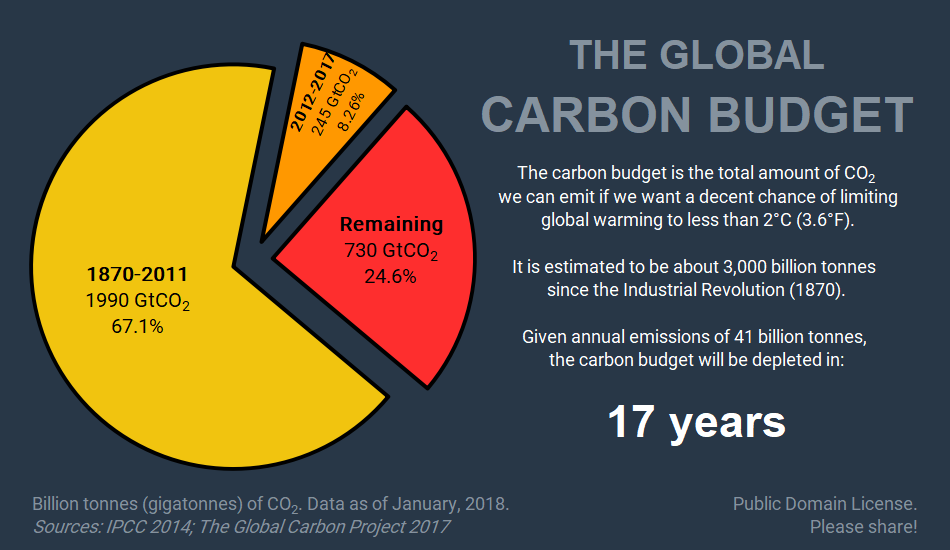
In 2015, the countries of the world decided that global warming must be limited to less than 2°C of warming (3.6°F), above the global average temperature before the Industrial Revolution. In other words, the goal is to avoid emitting so much carbon into the atmosphere that this would come to pass. That gives us a carbon budget: a total amount of carbon we can ‘spend’ — or emit — which scientists have calculated is only about 700 billion tonnes from 2018. At the current rate of emissions, we will hit that target in less than 20 years. And that’s for the 2°C limit — ideally, we would want to limit the temperature increase to much less than that.
The calculations and measurements that lie behind the carbon budget are complex, but you don’t have to be a scientist to understand the basis of it. To help, I’m going to give you two analogies to explain what global warming is and the role of CO2 emissions.
![]()
First, think of the earth as having a blanket. This blanket is made up of CO2 and other greenhouse gases (but mainly CO2), and it’s made life on earth pretty comfortable. The blanket traps heat from the sun — it’s allowed to get in, but a certain amount if it isn’t allowed to leave and is instead reflected back to earth. This is what’s known as the ‘greenhouse effect’ and scientists have known about it for almost 150 years. We’re right in the Goldilocks zone of not too hot and not too cold, but just right, and in this zone, animal life and human civilization have flourished. Without this blanket, the earth would be cold and lifeless like Mars, which doesn’t have one.
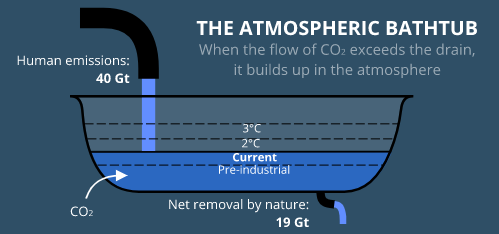
In that time, however, we’re been making the blanket thicker — much thicker — by adding more CO2 to the atmosphere. That brings us to the second analogy. It’s helpful to think of the atmosphere as a giant bathtub. It’s got a faucet and a drain, and a certain amount of CO2 in it. The amount of CO2, as we know, regulates the earth’s temperature. CO2 is unlike many other pollutants, which are cleaned up by mother nature in a few days, weeks or years at most — instead, it accumulates in the atmosphere.
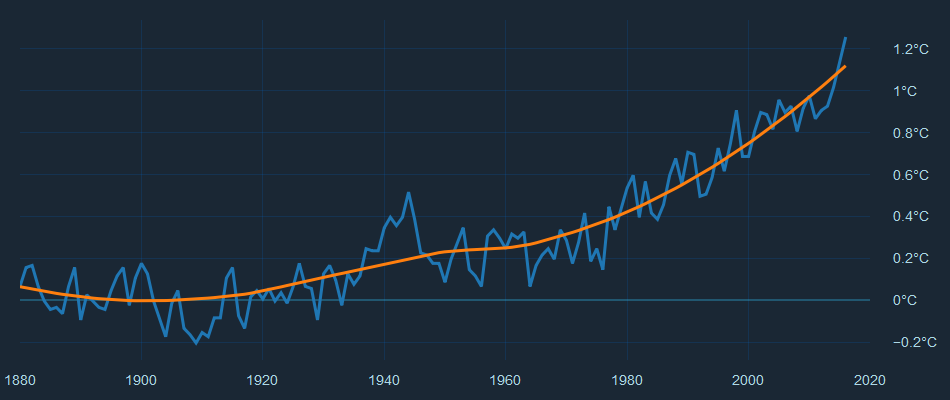
Before the Industrial Revolution, the drain and the faucet were more or less in balance. The CO2 level went up a little and down a little, but natural processes kept temperatures more or less stable, not going much above the 19th century average for millions of years. The problem is that we’re filling CO2 into the tub at a much, much faster pace than it’s draining. Already we’re at a CO2 level that the earth has not seen in millions of years, and the global average temperature has followed suit (see figure below). The more we fill up the tub, the more temperatures will rise. And because excess CO2 drains very slowly, it will take millennia for the CO2 level to reach the level it had before the Industrial Revolution.
Knowing how CO2 affects temperature makes it possible to calculate a carbon budget for any given temperature target we want above the pre-industrial average.
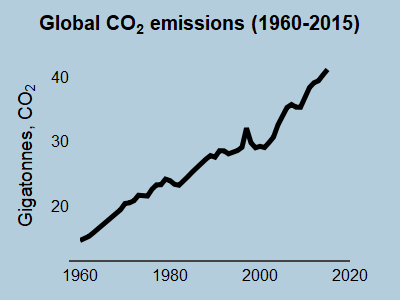
The 2°C (3.6°F) target is the official upper limit the world decided it can tolerate in the 2015 Paris Agreement. Scientists have calculated the total amount of CO2 we can put in the atmosphere since 1870 to limit global warming to less than 2°C, and the answer is a about 3,000 billion metric tonnes (3,000,000,000,000 tonnes or 6,613,868,000,000,000 pounds!), give or take. That is a massive number, but by the end of 2017, we had already spent about 2,250 billion tonnes, leaving only 730 billion tonnes left before we exceed 2°C (for the precise numbers, see table below). And because we’re releasing about 40 billion tonnes of CO2 into the atmosphere every year, that gives us less than 20 years from the beginning of 2018 before that budget is depleted.
The big unanswered question so far is, of course, so what if we go over the budget?
There is nothing magical about the 2°C limit: it’s just nice and round number that was picked because it was politically expedient and because it was, when it made its international break-through in 2007-2008, still, distant in time. Although the evidence suggests that the really, really dangerous consequences of global warming will lie somewhere beyond 2°C, crossing it does not immediately spell the end of the world. But every tonne of CO2 in the atmosphere and every fraction of a degree of temperature increase leads to increasingly destructive effects. If we have to have a target, many would prefer that we set a 1.5°C limit, because sea-level rise, for example, could be very dangerous if temperatures were to rise more. A 1.5°C target would set a very stringent limit on emissions, which we by some estimates we already have exceeded.
Today the planet is on average 1°C hotter than it was 100 years ago. That’s a temperature increase you would barely be able to feel on your skin, but it is already leading to sea-level rise, flooding, droughts and heat waves all across the planet. It’s not my intention to get into the consequences of climate change (that’s for another post) — the point is, there is no safe amount of warming. With the prospect that future climate change will hurt those already vulnerable the most, the only humane and compassionate goal has to be to limit global warming as much as possible. The carbon budget merely makes it clear how little we have to go on before we hit very undesirable territory.
Technical discussion
The promise of carbon budgets is that we can illustrate how little carbon we have left to ‘spend’ before we hit temperature targets we don’t want to exceed. When I learned to use Plotly to create pretty graphs, I wanted to represent the carbon budget in visual form, as a ‘carbon pie’.
What I soon discovered, however, is that carbon budgets are not straight-forward — there are many budgets and large uncertainties are inherent in them.
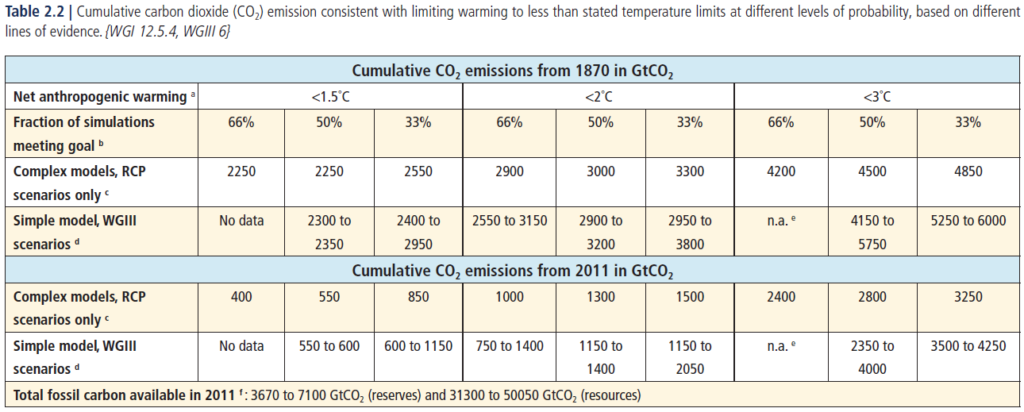
So which budget should we heed? We don’t really ‘pick’ a budget so much as we look at the different ones and look at what they tell us about when we might hit different targets, given different probabilities and methodological decisions. Science does not make any statements about which targets are preferable, it only tells us when we will hit those targets. Table 2.2 form the Synthesis Report of the IPCC’s Fifth Assessment Report gives an overview of 1.5°C, 2°C and even 3°C budgets, for three different probabilities, using two different types of models (see figure). For example, for a 66% probability of not exceeding 2°C, the total carbon budget from 1870 is (according to the simple models) 2,550 to 3,150 billion tonnes. The IPCC calls this probability a ‘likely’ chance. There is an even chance, or 50% probability, that the range is somewhat higher, from 2,900 to 3,200 billion tonnes.
So far so good, but you’ll notice that I’ve drawn my numbers from the ‘simple models’ rather than the ‘complex models’. Without getting getting into the technical details behind the models (you can read about that in Rogelj et al. 2016 or in Glen Peters’s blog at CICERO (see sources)), I have to mention two important differences in the numbers they produce.
The first difference is that the complex models assume business-as-usual until the end of the 2100, including with emissions of other greenhouse gases, where as the simple models do not. Although CO2 is the most important GHG, other gases contribute about a quarter of all global warming to date. High emissions of non-CO2 gases significantly reduces the CO2 budget, and the complex models therefore produces comparatively smaller numbers. The simple models, on the other hand, make some (perhaps) heroic assumptions about reductions in other GHGs, for example with a 40% reduction in methane emissions. That gives us a higher CO2 budget.
The second difference is that the complex models calculate how much carbon we have emitted at the time when we exceed the carbon budget, whereas the simple models calculate the maximum amount of carbon we can emit to avoid exceeding the carbon budget (in jargon, one is a ‘threshold exceedance limit’, the other a ‘threshold avoidance limit’)
Because of lags in the climate system, it takes about ten years for all the warming inherent in current emissions to be realized. In plain English, even if we stopped CO2 emissions today, cold turkey, the global average temperature would still go up by about 0.25 degrees over the next ten years. That has to do with heat exchange with the oceans, among other things. The simple models account for this, taking into account the warming that occurs after emissions have reached zero (or net zero). Following Rogelj et al and Glen Peters, it’s thus better to use the simple models, because the complex models guarantee overshooting the target.
But why not use the 1.5°C target, isn’t that more desirable? Well, yes, but because of the future warming we are already committed to, we are almost beyond that already. Looking at Table 2.2 again, for a 50-50 chance of staying below 1.5°C (the models were unable to calculate a scenario with a 66% of avoiding 1.5°C…), the carbon budget from 2011 was 550-600 billion tonnes. If we correct for cumulative emissions by 2011 (+100 billion tonnes) and subtract emissions from 2012 to 2017 (-245 billion tonnes) we are left with just 200 to 250 billion tonnes of emissions from today.
We will burst through that budget in 2022 at current rates of emissions. The 1.5°C target is thus likely unachievable without significant ‘negative emissions’. That puts the focus on the next target up — two degrees — because it may still be within reach. And that gives us our carbon budget. Still, removing carbon from the atmosphere again and storing it underground will almost certainly be necessary later in this century, if it proves technically possible on a large enough scale. That’s a big ‘if’.
In other words, the goal is not to blow the whole budget. We want to save as much as possible.
Living within our means
In 2016, prominent climate researchers and political leaders published a letter in Nature warning that the world now has until the end of 2019 to reach peak CO2 emissions, given the 2°C target and accompanying carbon budget, after which emissions would have to decline rapidly for a chance of getting to near zero around mid-century. There are some good news, as there are signs that emissions have almost flat-lined in the last few years, having risen fast in the years before that, so we could be starting a decline soon. A slow-down in the emissions of China and declining American emissions (not on purpose) are the main causes of this. China has promised to peak its emissions before 2030; hopefully, they will do so a lot sooner.
The not-so-good news is that the proposed schedule for decarbonization is extremely ambitious. On average, to reduce emissions to — let’s make the maths easy — say 10 billion tonnes in 2050, and given 40 billion tonnes of emissions in 2020, the annual emission reduction would have to be 1 billion tonnes a year. It doesn’t sound impossible, since we would easily increase emissions by that much in any given year, but considering the lack of political commitment and private buy-in to doing anything about global warming. And although there may be many low hanging fruits to pick, at little expense, the taller apples will be hard and expensive to retrieve.
I’m not saying it is impossible to get to near-zero emissions by 2050. I certainly hope we will. But it will be difficult, and it will require nothing less than a total transformation of the global economy, with far-reaching consequences for every human being, animal and plant on this planet. But that’s a topic for another post.
Sources and notes
Cumulative emissions
The Global Carbon Project recalculated emissions from 1870-2017. The new figure is 2,235 billion tonnes. Subtracting emissions from 2012-2017, that gives us a new figure for cumulative emissions from 1870-2011 of 1,990 billion tonnes. That’s important because it’s 100 billion tonnes higher than the figure used by the IPCC when it calculated the different carbon budgets in 2013. It’s not possible to know exactly what past emissions were, but the point is that as a result of the recalculation, historical emissions were likely higher than previously estimated, and the remaining carbon budget is consequently lower.
Sources:
- For explanation, see The Global Carbon Budget 2017, Le Quéré et al., 2017 (free)
- For the cumulative emissions see Table 9 on page 64.
- To download the numbers, go to The Global Carbon Project
IPCC sources
I read the IPCC’s Fifth Assessment Report so you don’t have to! Unless you want to, of course. You can learn a lot from reading the IPCC’s extremely comprehensive and information dense reports. I recommend the synthesis report or the summaries for policy makers from the three separate reports.
Information about the carbon budget is found in several different places in the reports:
Other sources
- Differences between carbon budget estimates unravelled, Rogelj et al., 2016
- Should climate policy aim to avoid 2°C or to exceed 2°C? (CICERO)
- How much carbon dioxide can we emit? (CICERO)
- The Global Carbon Atlas (country emissions data)
- NASA Goddard (temperature data)